Analytics reports: Performance
The Performance menu contains reports that help you determine how well an organization processes documents by analyzing processing times. The Performance menu contains these reports:
-
Total process time - Displays the average processing time for documents for the current month. You can choose custom date ranges. Move the pointer over the data points in the graph to see more detailed information.
-
Process time by sender - Displays the average processing time for documents grouped by the sender (supplier/customer). Use the Account type box to filter accounts by accounts payable and accounts receivable. Move the pointer over the bars in the graph to see more detailed information.
-
Total verification time by user - Displays the total time (in hours) a user has spent verifying documents. Only the top 50 users who spend the most time verifying documents are displayed. This report helps you see how much time, in total, your users spend verifying documents. You can also compare users to see who spends the most time verifying documents.
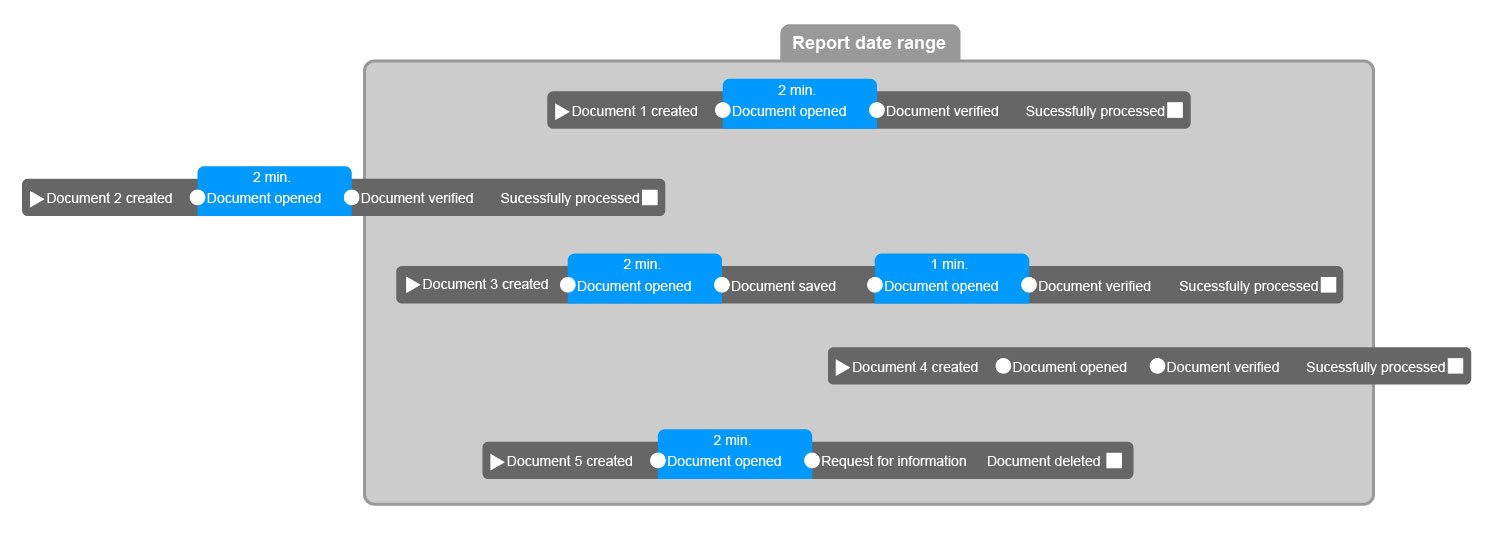
Verification begins when a user opens a document, and ends when the document is saved, rejected, verified, held or a request for information is made. Only documents that are successfully processed or deleted within the specified time period are used in the calculation.
The image above shows how AP Essentials determines if a document is included in the verification time calculation. Document 1 is clearly within the date range. Two minutes passed from the moment the document was opened until the moment the document was verified, so two minutes are added to the total verification time of the user. Although document 2 was created outside of the date range, it was successfully processed within the date range, so its two minutes are also used in the report. Document 3 was handled two times and was successfully processed within the date range, so 3 minutes are added to the total verification time of the user. Document 4 was successfully processed outside the date range, so it is not used in the time calculation. Document 5 was deleted within the date range, so its time is added to the time calculation. If we assume all of these documents were processed by the same person, the total verification time is nine minutes.
-
Verification time by sender - Displays the average time spent verifying one document by sender (supplier/customer). In other words, this report tells you which sender's documents take the longest time to verify on average. Only the top 50 senders that take the most time are displayed. Select the bars in the graph to see the verification time by user.
-
Verification velocity - Displays the average time (in minutes) it takes for a user to verify one document over time on a daily basis. This report is helpful because you can easily see if users are maintaining reasonable verification speeds. Decreasing trends in the line graph indicate users are verifying documents more quickly, whereas increasing trends indicate it is taking more time. A new user, for example, might display a gradually downward trending graph as the user becomes more proficient at verifying documents. In contrast, large volumes of problem documents, or long documents with large numbers of line-items, might decrease user efficiency, causing an upward trend in the graph. You can also use this report to compare verification velocities between users.
-
Extraction - Displays reports that depict how well AP Essentials automatically finds fields on documents. Learn more about the Extraction report.
-
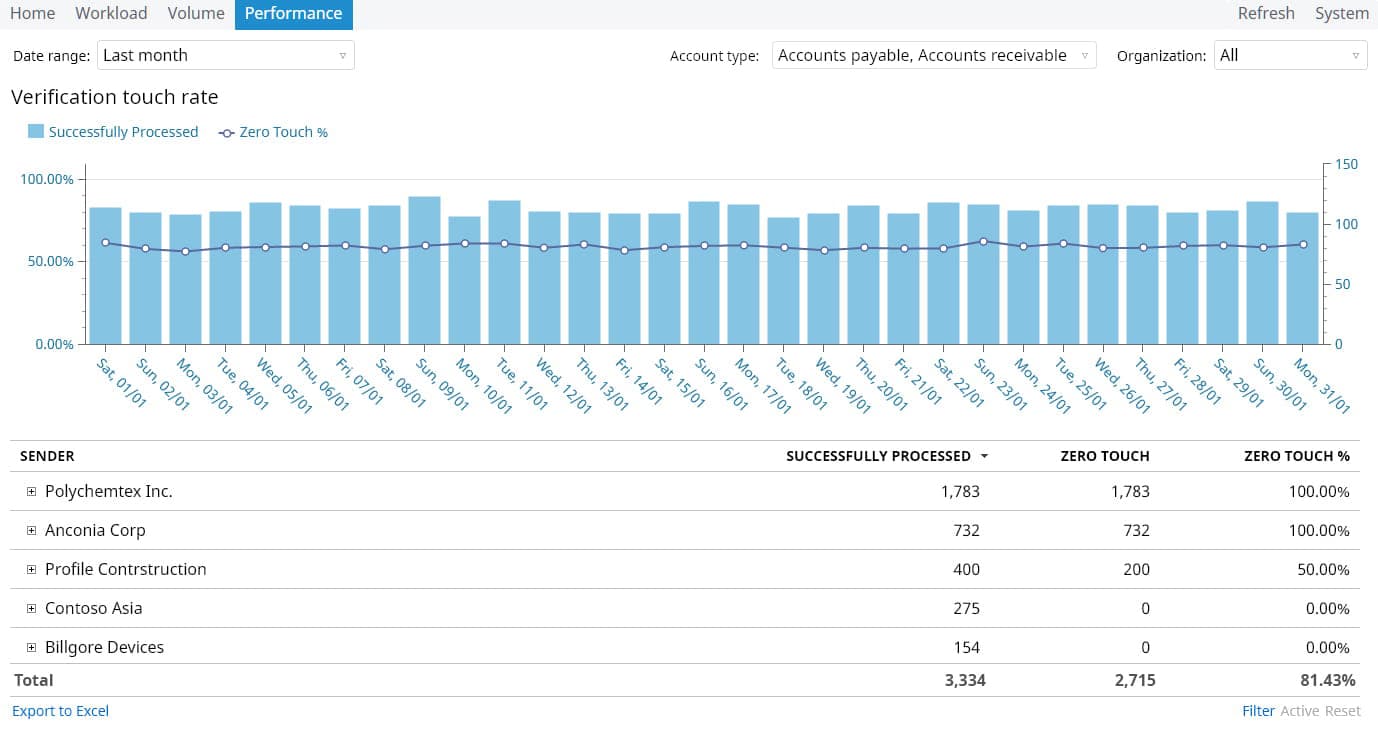
Verification touch rate - Displays the percentage of documents that have bypassed manual verification (zero touch) in relation to the total number of documents verified over time.
Touch rate calculations work the same for suppliers and customers. If a document is "touched," it means it was manually verified. Therefore, "zero touch" refers to documents that were automatically processed without manual verification. In other words, zero-touch documents were never touched manually. A low "zero touch" rate indicates more documents requiring manual adjustment, whereas a high zero-touch rate indicates a high level of automation. By examining the touch rate you can determine, for example, which supplier's documents do not pass through the system easily.
In the example below, you see 1,783 documents from Polychemtex Inc. were successfully processed. None of those documents were processed manually. In other words, the data was extracted and sent to the target system without manual adjustment by AP Essentials Office users. Since 100% of the documents were processed automatically, without manual intervention, the zero-touch rate is 100%, which is the best possible result. Likewise, Anoconia Corp also has a perfect score. Half of Profile Construction documents required manual adjustment, yielding a zero-touch rate of 50%. The remaining suppliers required manual adjustment of all documents, resulting in a zero-touch rate of 0%, the lowest possible score. Low zero-touch rates can indicate poor performance, which might require investigation, depending on the quantity of documents affected and which workflow settings you use.

Use the SENDER NUMBER column to help you locate problematic senders. LOCK ONLINE LEARNING can also help your analysis. For example, if documents from a sender have poor performance, and online learning is locked, the touch rate is likely to remain unchanged until you unlock learning for that sender. Conversely, if BYPASS VERIFICATION is enabled for a sender, it can cause extraordinarily high performance.
If you use Workflow services and Allow account coding during verification is enabled, touch rates can be skewed adversely because coding an invoice during verification counts as "touching" a document. Currently, there is no way to distinguish between coding during verification and adjustments made due to poor interpretation.
Any adjustments made by line-item pairing also count as touching.
If the DATA VERIFICATION setting is set to Always, the zero-touch rate will always be 0% because this forces all documents to be manually verified. Conversely, setting DATA VERIFICATION to Never will always give a 100% zero-touch rate because documents are never verified.
When you investigate low zero-touch rates, consider the following conditions as possible causes:
- As noted above, account coding during verification, line-item pairing and the DATA VERIFICATION setting can affect the touch rate.
-
Low-resolution documents, which cause poor interpretation.
-
Incorrect selection of the buyer/seller or document type during document upload.
-
Incorrect document separation.
-
Incorrectly drawn line-item fields or header fields.
